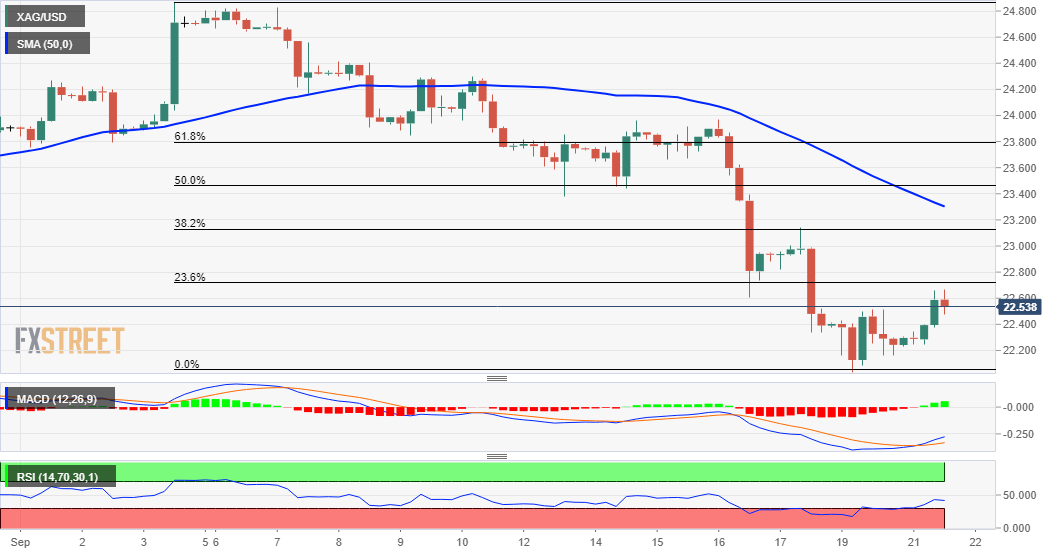
Silver Price Analysis: XAG/USD tests 23.6% Fibo. level, around $22.65-70 area
- Silver built on its goodish recovery move from the $22.00 mark, or YTD lows touched on Monday.
- Mixed oscillators on hourly/daily charts warrant some caution before placing fresh bullish bets.
Silver gained some positive traction on Tuesday and moved away from the lowest level since November 2020, around the $22.00 mark touched in the previous day. The commodity, for now, seems to have snapped three consecutive days of the losing streak and was last seen trading around the $22.60-65 region, up over 1.50% for the day.
The mentioned area lies just ahead of the 23.6% Fibonacci level of the $24.87-$22.04 recent leg down. Some follow-through selling will be seen as a fresh trigger for bullish traders and set the stage for additional gains. The outlook is reinforced by the fact that technical indicators on hourly charts have been gaining positive traction.
That said, oscillators on the daily chart are still holding deep in the bearish territory and warrant some caution for bullish traders. Hence, any subsequent move up might still be seen as a selling opportunity and runs the risk of fizzling out quickly near the $23.00 mark. This is closely followed by the 38.2% Fibo. level, near the $23.10 region.
On the flip side, the $22.25 area now seems to protect the immediate downside ahead of YTD lows, around the $22.00 mark. A convincing break below will be seen as a fresh trigger for bearish traders and turn the XAG/USD vulnerable. The commodity might then accelerate the fall further towards testing September 2020 swing lows, around the $21.65 region.
Silver 4-hour chart

Technical levels to watch
