AUD/USD Elliott Wave Analysis: Bears target 0.7330 near term
- AUD/USD is trading above four-week resistance near 0.7430.
- The pair remains vulnerable for a corrective pullback.
- 38.2% Fibonacci retracement seen around 0.7330, potential bullish reversal.
AUD/USD bears are preparing to produce a corrective drop toward 0.7330 at least, before resuming its rally.
The single currency pair has taken out resistance at 0.7430 and might have terminated potential Wave A around 0.7480.
Looking at the larger degree wave structure, AUD/USD has dropped from 0.8000 toward 0.7100 mark, unfolding as a standard flat (3-3-5) structure, labeled as Wave (A) on the daily chart here.
Either the correction is complete at 0.7100 or AUD/USD is expected to carve Wave (B) higher followed by another drop below 0.7100 to complete.
We have presented a potential Wave (B) rally as the preferred wave count here.
AUD/USD has rallied between 0.7100 and 0.7480 hitting 38.2% Fibonacci retracement of Wave (A), also taking out resistance at 0.7430 as discussed earlier. It could be labeled as Wave A within the corrective rally A-B-C, toward the 0.7650 mark.
If the above-proposed wave counts are correct, AUD/USD should resume lower towards the 0.7330 mark, to terminate Wave B of the counter-trend rally.
Also, note that 0.7330 is 38.2% Fibonacci retracement of Wave A here.
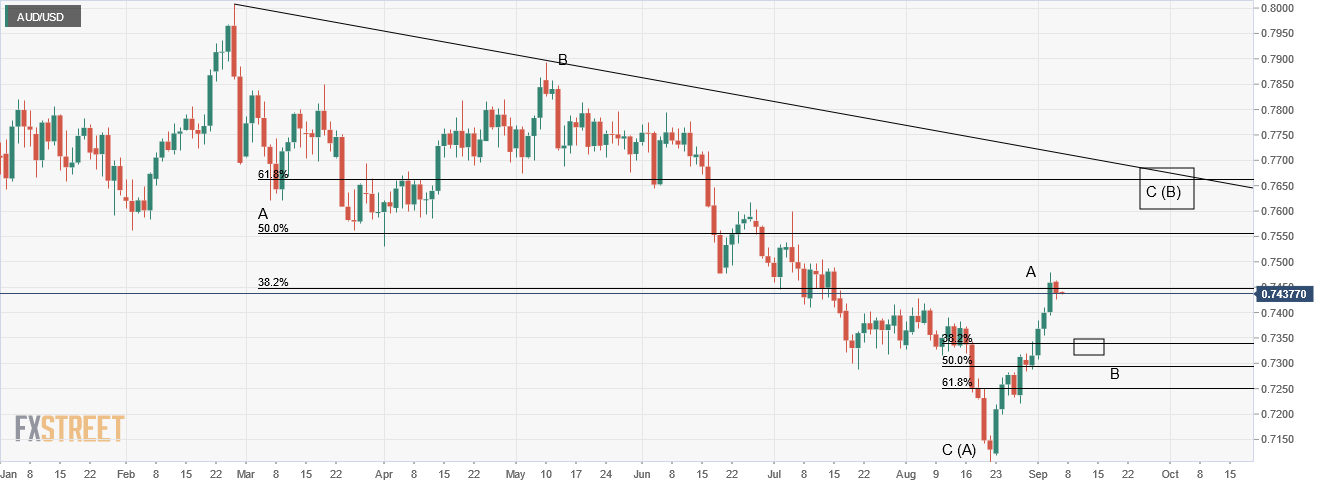
Bulls are expected to be back in control from close to 0.7330 or 0.7250 mark, to push higher towards 0.7650, as Wave C progresses.
AUD/USD might resume its drop from 0.7650, potential Wave (B) termination.
Alternate count
Alternately, AUD/USD might have completed its corrective drop A-B-C between 0.8100 and 0.7100 mark respectively.
If correct, the single currency pair has turned bullish against 0.7100.
Technical levels