Silver Price Analysis: XAG/USD challenges bearish flag support, just above mid-$25.00s
- Silver extended the previous day’s retracement slide from over one-week tops.
- An ascending channel constitutes the formation of a bearish flag chart pattern.
- Technical indicators support prospects for an eventual break to the downside.
Silver witnessed some heavy selling on the last day of the week and extended the previous session's retracement slide from over one-week tops.
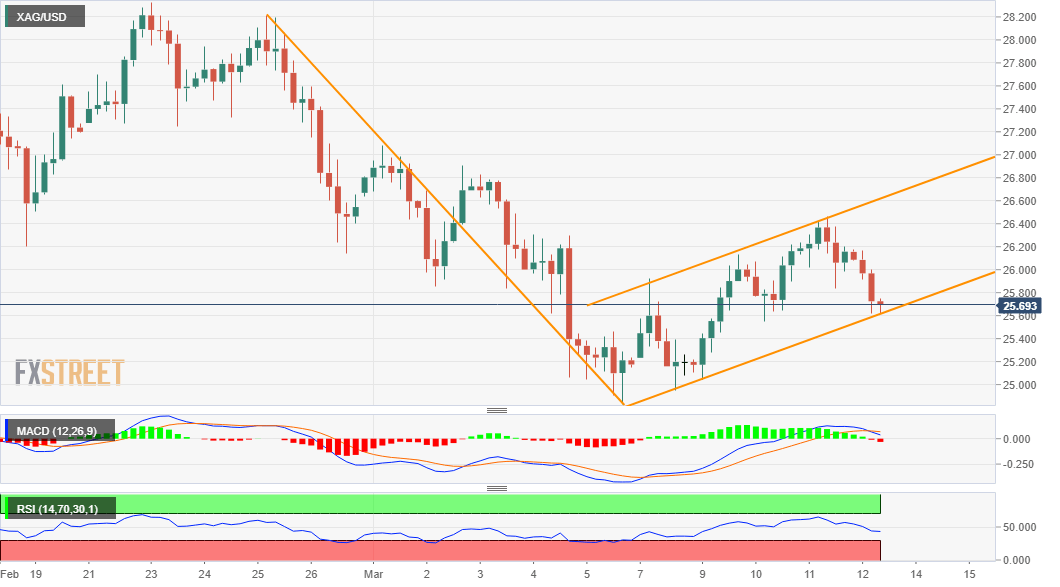
From a technical perspective, this week's solid rebound from the vicinity of five-week lows stalled near a resistance marked by the top end of a short-term ascending channel. Given the recent sharp pullback from the key $30.00 psychological mark, the channel constitutes the formation of a bearish flag on short-term charts. T
The negative set-up is reinforced by the fact that oscillators on the daily chart – though have been recovering from lower levels – are still holding in the bearish territory. Adding to this, technical indicators on hourly charts have just started gaining negative momentum and support prospects for an eventual breakdown.
That said, it will still be prudent to wait for sustained weakness below the channel support, near the $25.55 region, before confirming a fresh breakdown and positioning for any further depreciating move. The XAG/USD might then turn vulnerable and accelerate the slide back towards challenging the key $25.00 psychological mark.
Some follow-through selling below monthly swing lows, around the $24.85-80 region will reaffirm the bearish bias and pave the way for a further decline. The downward trajectory has the potential to drag the XAG/USD further towards the very important 200-day SMA support, currently around the $24.00 round-figure mark.
On the flip side, any meaningful recovery attempt might now confront a stiff resistance and remain capped near the $26.00 horizontal zone. However, a sustained move beyond might trigger a fresh bout of the short-covering move and push the XAG/USD back towards testing the trend-channel resistance, currently near the $26.55-60 region.
XAG/USD 4-hourly chart
Technical levels to watch