Mengonfirmasi Anda bukan dari AS atau Filipina

Dengan memberikan pernyataan ini, saya secara tegas menyatakan dan mengonfirmasikan bahwa:
  • Saya bukan warga negara atau penduduk AS
  • Saya bukan penduduk Filipina
  • Saya, secara langsung maupun tidak langsung, tidak memiliki lebih dari 10% saham/hak suara/kepentingan dari penduduk AS dan/atau tidak mengontrol warga negara atau penduduk AS dengan cara lain
  • Saya tidak berada di bawah kepemilikan langsung atau tidak langsung untuk lebih dari 10% saham/hak suara/kepentingan dan/atau berada di bawah kontrol warga negara atau penduduk AS dengan cara lain
  • Saya tidak berafiliasi dengan warga negara atau penduduk AS dalam hal Bagian 1504(a) dari FATCA
  • Saya menyadari tanggung jawab saya jika membuat pernyataan palsu.
Untuk tujuan pernyataan ini, semua negara dan wilayah dependen AS disamakan dengan wilayah utama AS. Saya berkomitmen untuk membela dan membebaskan Octa Markets Incorporated, direktur dan pejabatnya dari klaim apa pun yang timbul akibat atau terkait dengan pelanggaran apa pun atas pernyataan saya.
Kami berkomitmen menjaga privasi dan keamanan informasi pribadi Anda. Kami hanya mengumpulkan email untuk menyediakan penawaran khusus dan informasi penting tentang produk dan layanan kami. Dengan memberikan alamat email, Anda setuju untuk menerima surat tersebut dari kami. Jika Anda ingin berhenti berlangganan atau memiliki pertanyaan maupun permasalahan, silakan hubungi Layanan Pelanggan kami.
Octa trading broker
Buka akun trading
Back

CHF/JPY Price Analysis: Bears have this pair highup on their watchlist

  • CHF/JPY bulls are tiring out on the weekly chart in the form of a bearish rising wedge.
  • The hourly daily and hourly charts offer a prospect to the downside.

Bears are engaging the charts for this pair with CHF/JPY a high priority on the watchlist. There is confluence across the time frames that makes for a compelling bearish case for the cross.

The following is a top-down analysis that illustrates where the next opportunity for the bears could emerge from a break of support on the hourly charts.

Monthly chart

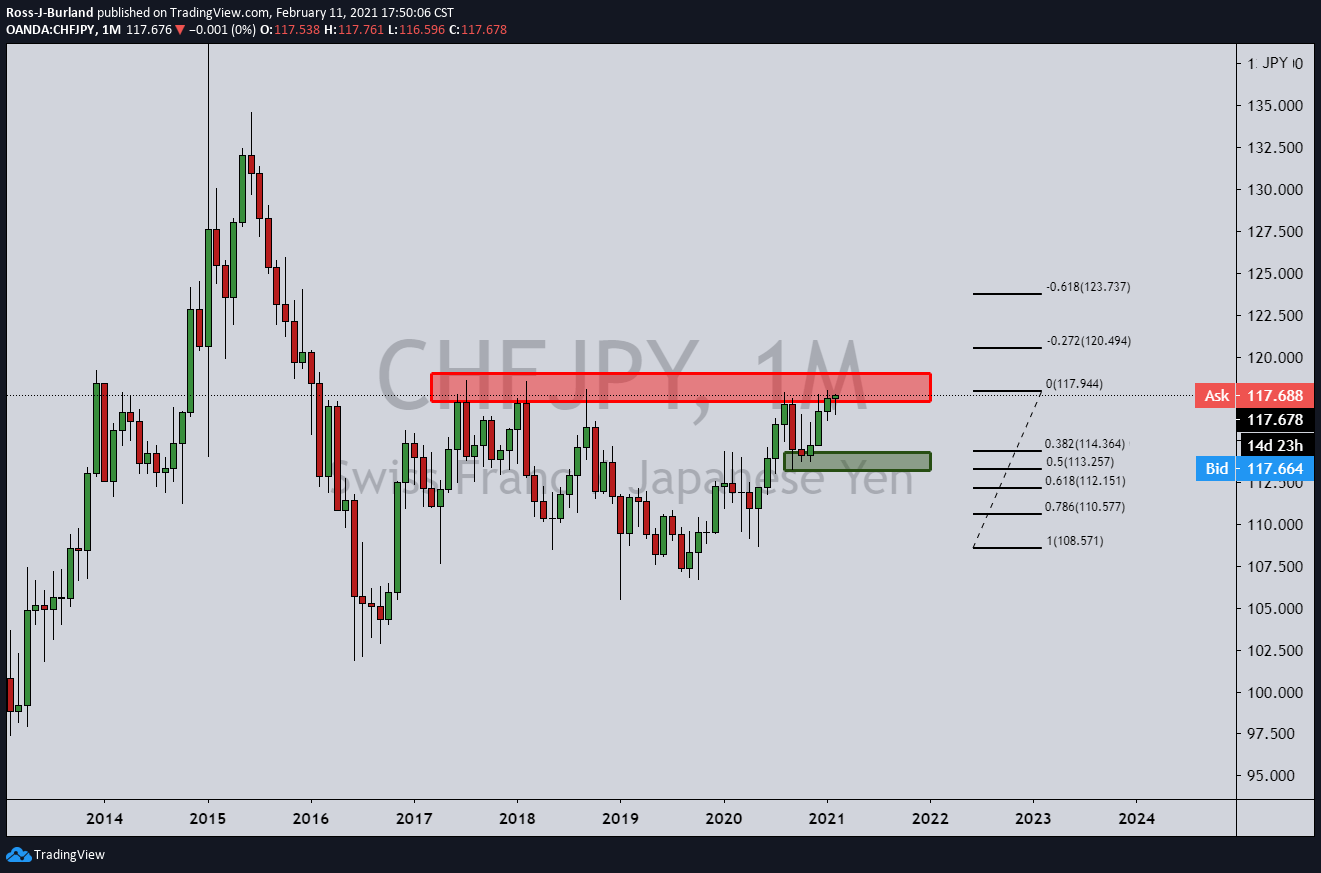
Monthly resistance is being tested and while there are still prospects of an extension of the monthly impulse, the lower time frames could offer a meanwhile downside opportunity. 

Weekly chart

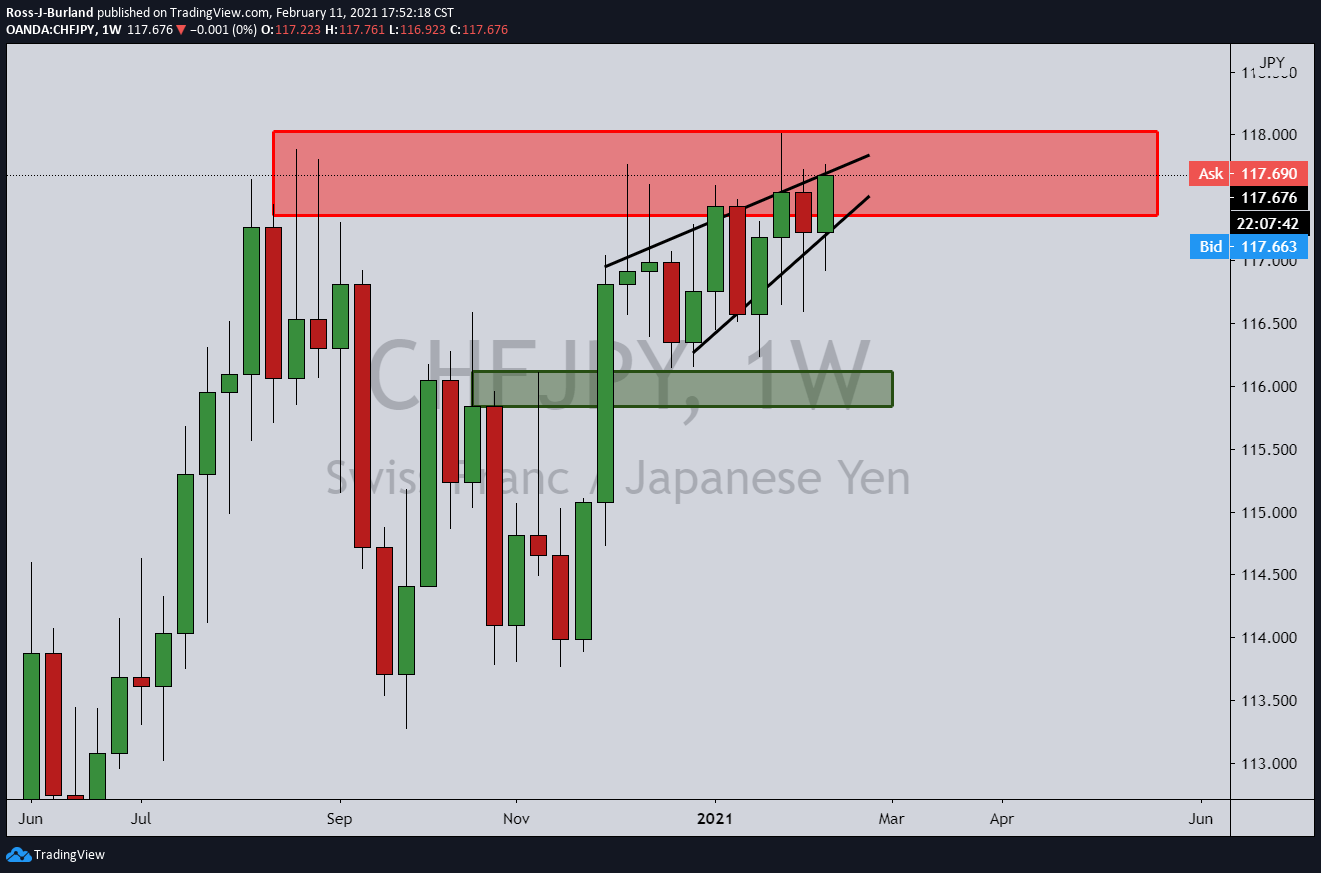
The rising wedge formation is regarded as a bearish chart pattern that begins wide at the bottom and contracts as prices move higher and the trading range narrows.

The fact that price is testing strong monthly resistance is an extra conviction of the downside bias. 

Daily chart

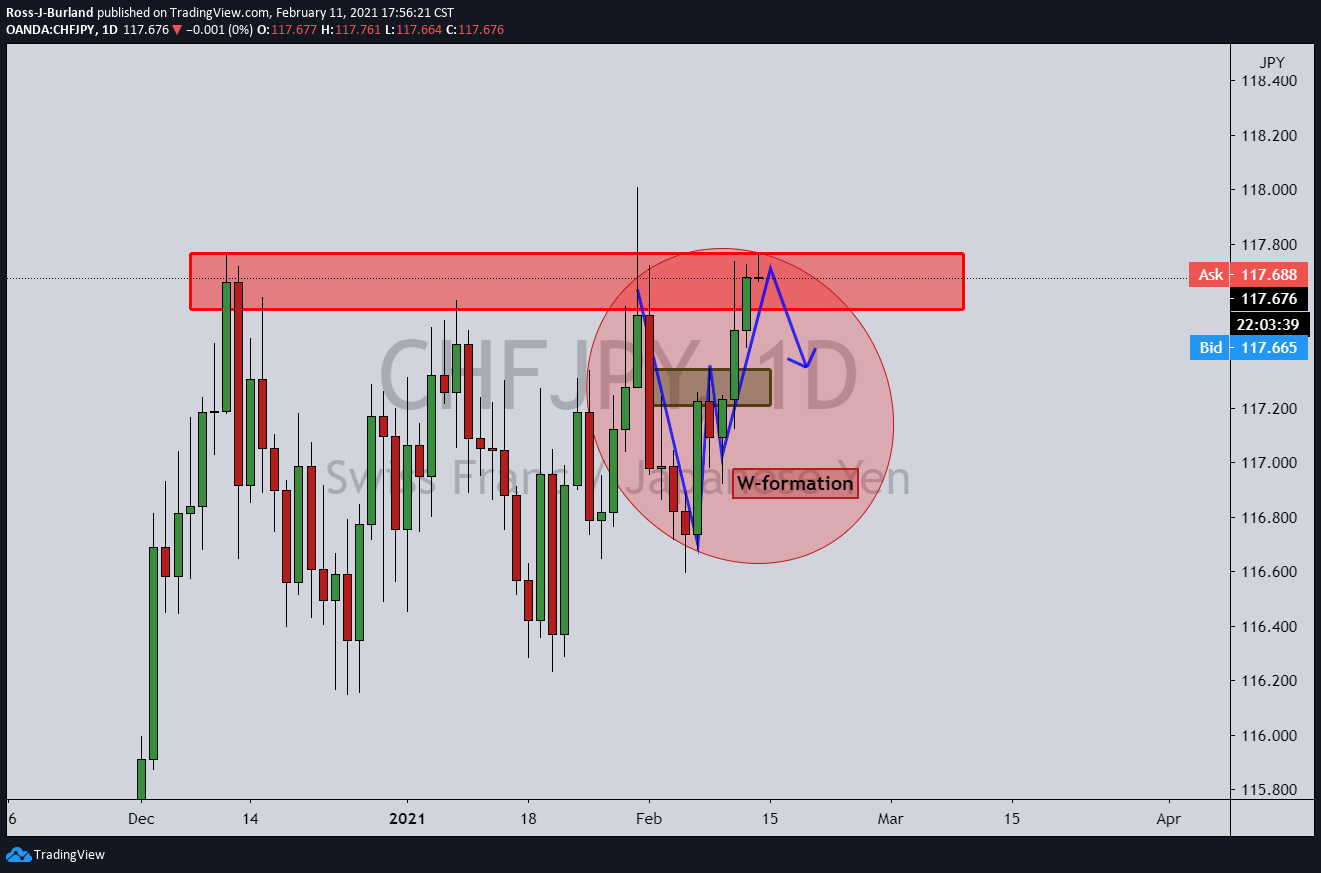
The daily chart has painted a W-formation from which bears would expect the price to retest the neckline of the formation. 

This could be worked upon from an hourly perspective as follows:

1-hour

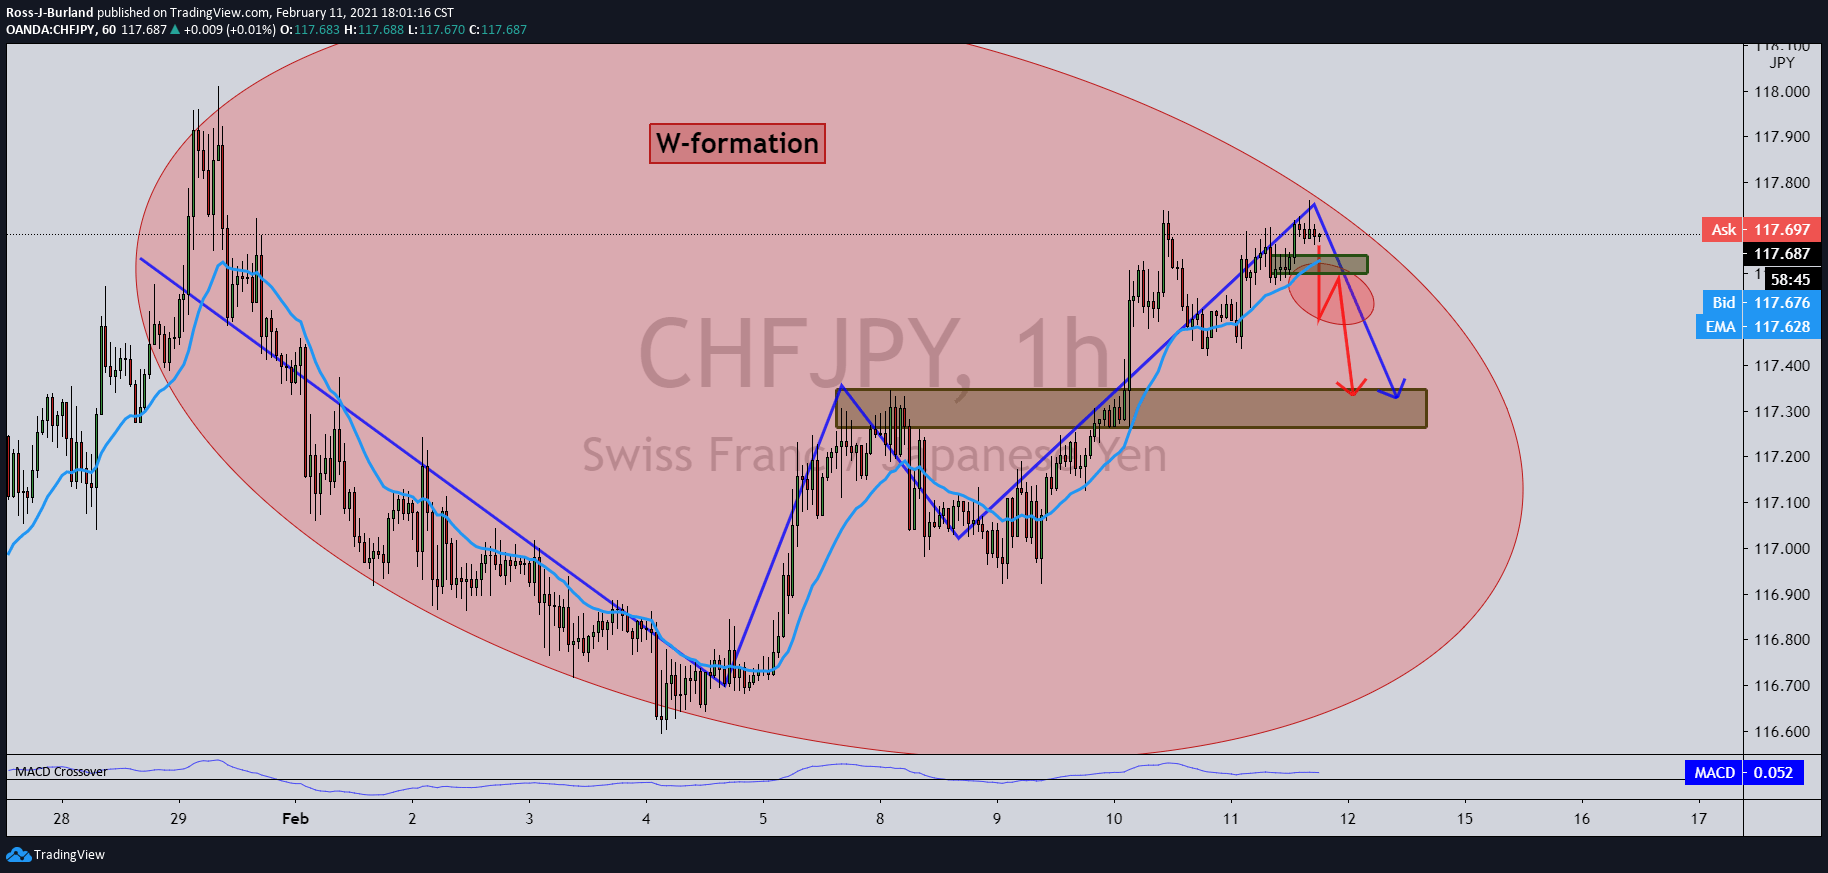
The 1-hour time frame has the price still in bullish territory, so there is no action to take at this juncture other than to monitor for bearish developments and structure.

MACD is bullish while above the zero line and the price is still above the 20-EMA

However, bears can expect a break below support which would send the price below the EMA and MACD below zero.

Bears would then anticipate the old support structure to act as resistance on a restest from which an optimal entry point targetting the W-formation's neckline.

Oil has a 'lot of upside', copper prices already at supercycle levels – Goldman Sachs

In his interview with S&P Global Platts, Jeff Currie, head of commodity research at Goldman Sachs, suggests further upside for oil while flashing red
Baca selengkapnya Previous

Silver Price Analysis: Sellers attack 12-day-old support line

Silver sellers flirt with the $27.00 during Friday’s Asian session. The white metal has been pressured since Wednesday, as portrayed by an immediate f
Baca selengkapnya Next