AUD/USD Price Analysis: Weak China PMI supports bearish indicator divergence
- China's Caxin PMI fell below 50 in April, inidicating contraction in the manufacturing activity.
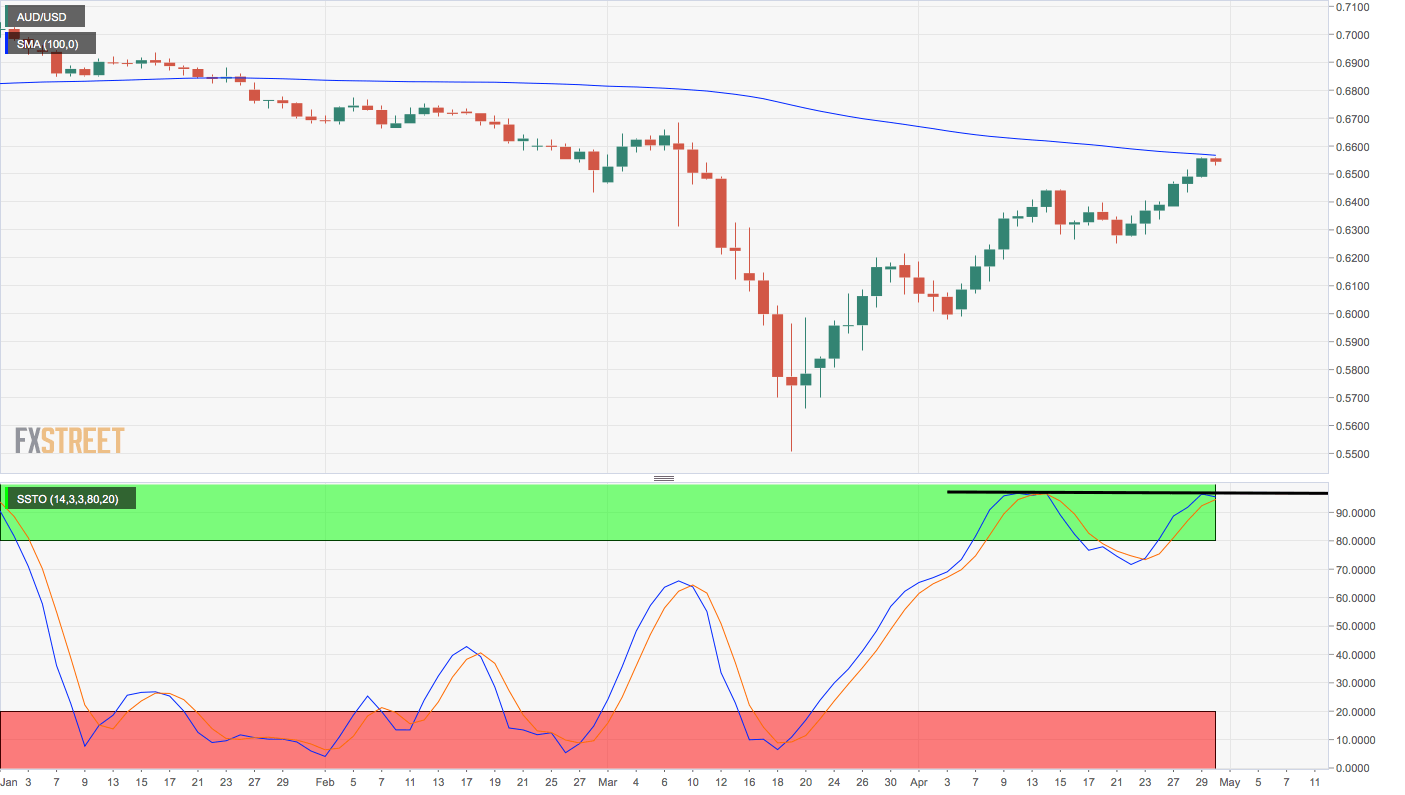
- AUD/USD's daily chart shows a bearish divergence of stochastic indicator.
A combination of dismal China data and early signs of buyer exhaustion on technical charts suggests scope for a pullback in the AUD/USD pair.
China’s Caixin Manufacturing PMI, which surveys small and medium-sized export-oriented companies, declined to 49.4 in April, missing the estimate of 50.5. A below-50 reading indicates contraction in the activity.
The government PMI printed above 50 early Thursday, but failed to inspire the AUD bulls.
The below-50 Caixin PMI is bad news for the Aussie dollar, a proxy for China. Additionally, the daily chart stochastic indicator is reporting a bearish divergence, which occurs when the indicator charts lower highs as opposed to higher highs on price.
All in all, the pair looks set for a pullback possibly to 0.65 or below. At press time, the spot is trading in the red at 0.6540. A close above the 100-day average at 0.6564 would signal a continuation of the recent rally from 0.6250.
Daily chart
Trend: Pullback likely
Technical levels