Back
4 Feb 2020
USD/INR Asia Price Forecast: Greenback weakens against Indian rupee, trades below 71.20 level
- Sellers broke below the bear flag and the 71.20 support level.
- Target on the way down can be located near the 70.40 level.
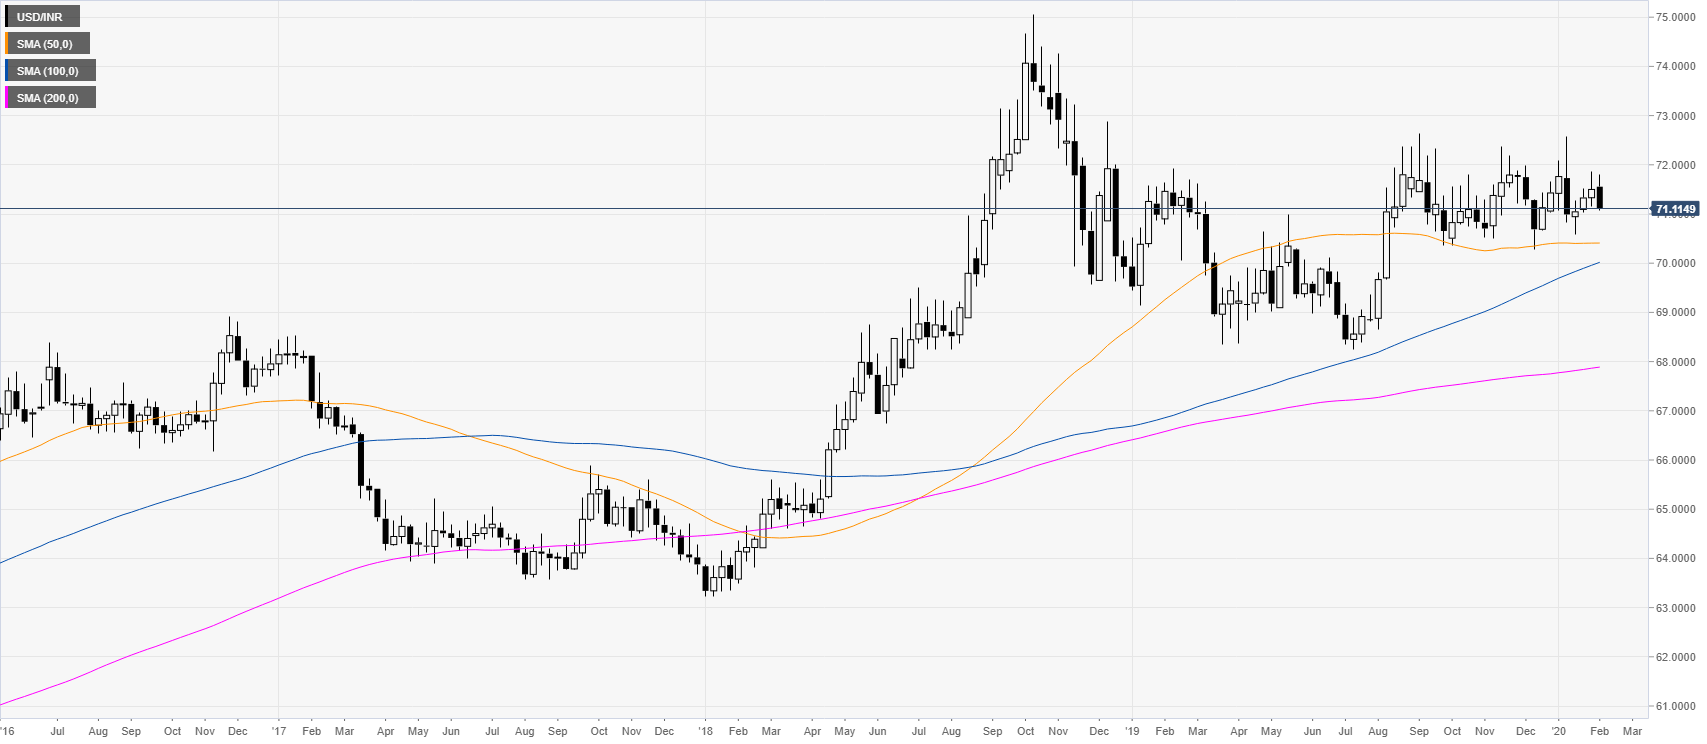
USD/INR weekly chart
Following the 2018 bull-run, USD/INR has been consolidating in a rectangle formation. The spot is trading above its main weekly simple moving averages (SMAs).
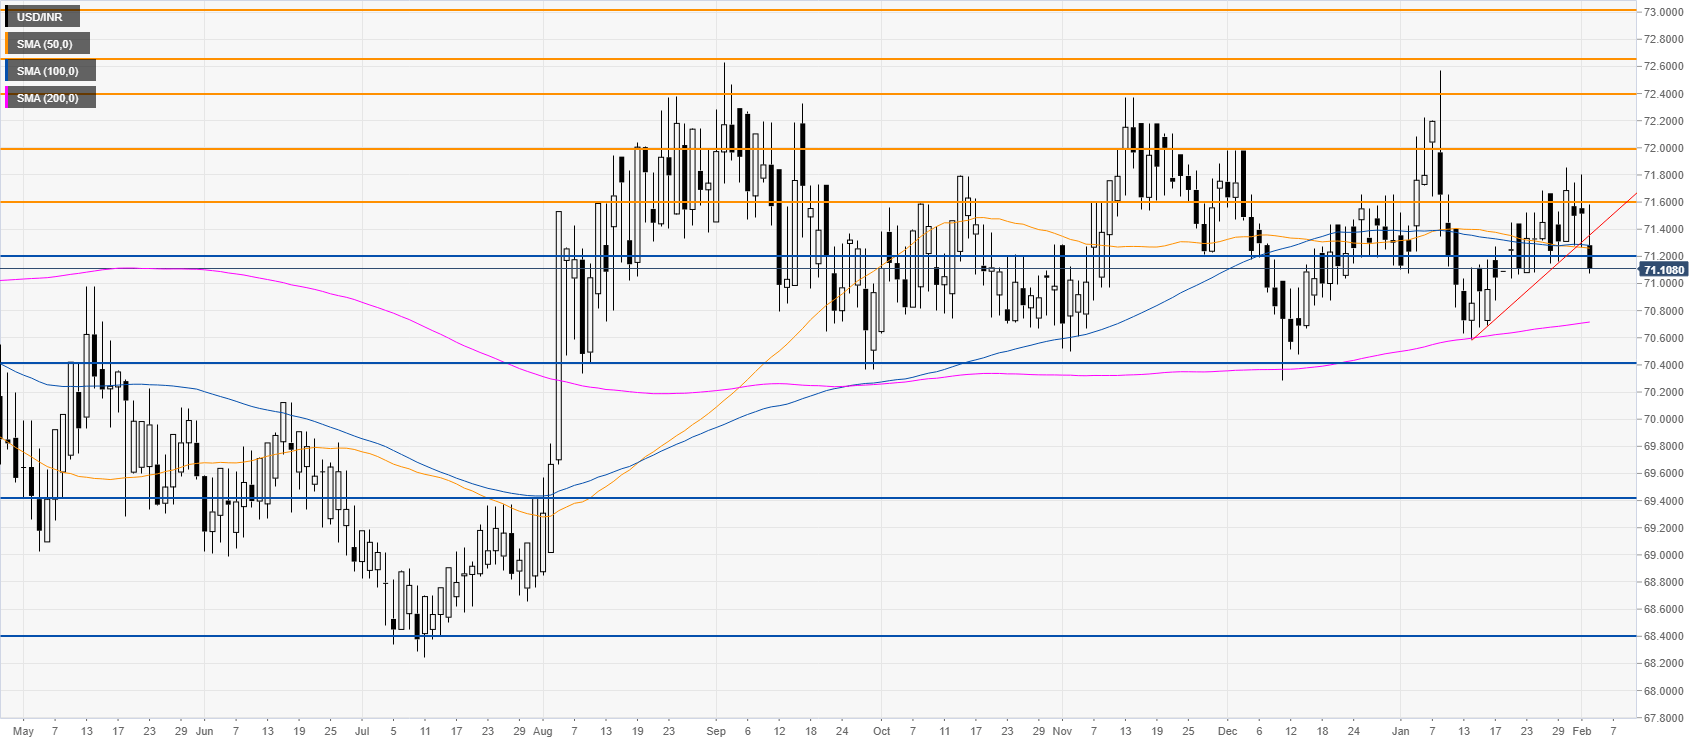
USD/INR daily chart
The spot broke below a bear flag pattern below the 71.20 support, opening the way down to the 70.40 price level. The 71.20 support becomes now resistance followed on the way by the 71.60 level.
Additional key levels