Back
22 Aug 2019
GBP/USD technical analysis: Struggles between 10/21-DMA amid bullish MACD
- GBP/USD seesaws inside a choppy range between 10 and 21-DMA.
- MACD flashes bullish signal.
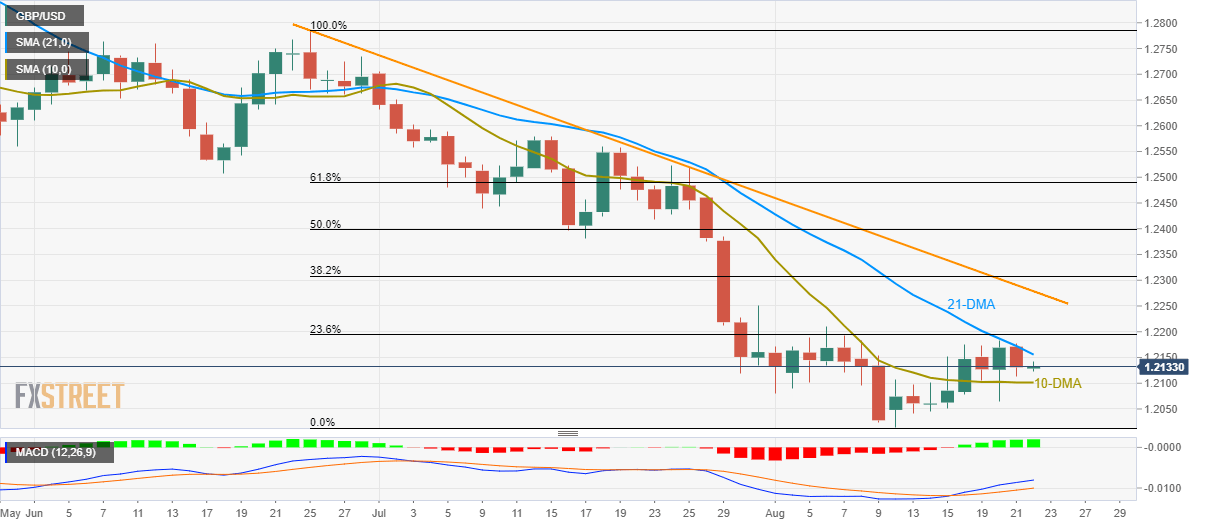
Despite reversing from the 21-day simple moving average (DMA), GBP/USD remains above 10-DMA as it trades near 1.2134 during Asian session on Thursday.
Supporting the pair’s upside is a bullish signal by 12-bar moving average convergence and divergence (MACD). However, a sustained break of 1.2156 comprising 21-DMA becomes necessary to lure buyers.
During the pair’s advances past-1.2156, 23.6% Fibonacci retracement level of June-August downpour, at 1.2195, and a downward sloping trend-line since late-June near 1.2280 can please the bulls.
Meanwhile, a daily closing below 10-DMA level of 1.2100 highlights the importance of 1.2050 and 1.2015 supports, a break of which can drag prices to further down below 1.2000 round-figure.
GBP/USD daily chart
Trend: Sideways