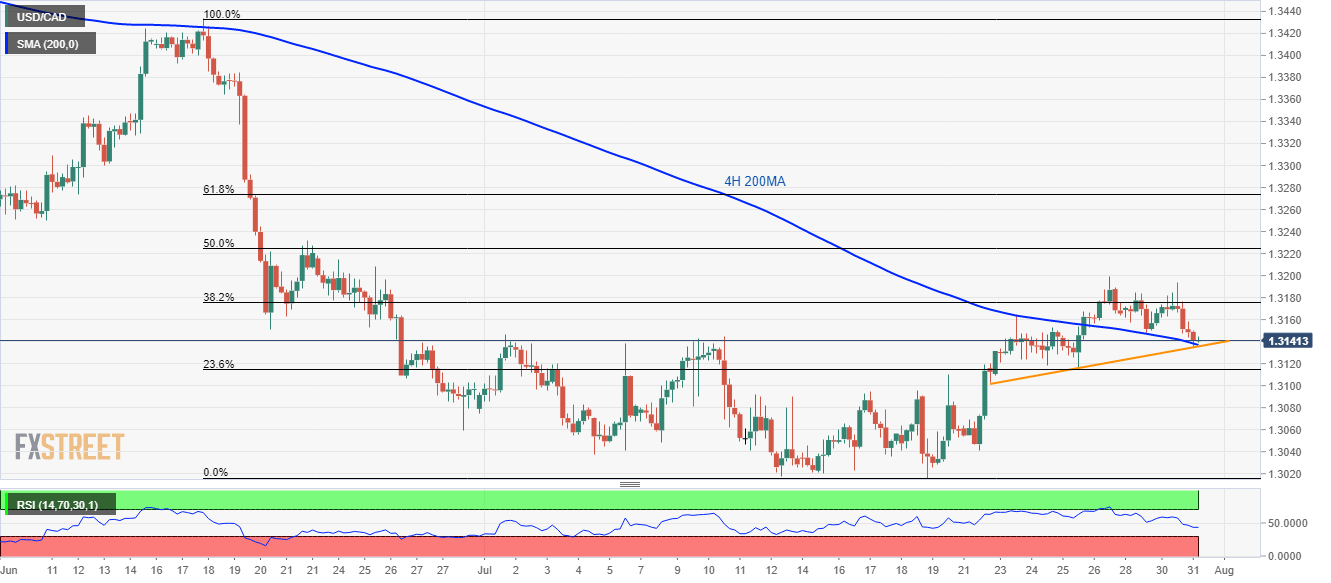
USD/CAD technical analysis: Buyers attempt comeback from 4H 200MA, multi-day old support-line
- USD/CAD nears the short-term key supports comprising 4H 200MA and a week-long ascending trend-line.
- 1.3200 seems to be the crucial resistance to watch during the upside.
Failure to cross 1.3200 couldn’t bode well for sellers as USD/CAD stops declining around key short-term support confluence while making the rounds to 1.3140 during early Wednesday.
200-bar moving average on the 4-hour chart (4H 200MA) and seven-day-old ascending trend-line portrays 1.3135/37 as the key support area that buyers can avail to register a bounce towards 38.2% Fibonacci retracement of June-July downpour, at 1.3175 and then target 1.3200 round-figure.
Should there be additional rise past-1.3200, June 21 top near 1.3230 and 61.8% Fibonacci retracement near 1.3275 may lure the bulls.
Alternatively, a downside break of 1.3135 can take rest on 23.6% Fibonacci retracement level of 1.3115 whereas 1.3100 and month’s low near 1.3016 might please sellers afterward.
Adding to note is declining 14-bar relative strength index (RSI) that can trigger the pullback if being oversold around the supports.
USD/CAD 4-hour chart

Trend: Pullback expected
