Back
24 May 2019
USD/CAD technical analysis: Greenback under pressure below the 1.3500 figure (yet again)
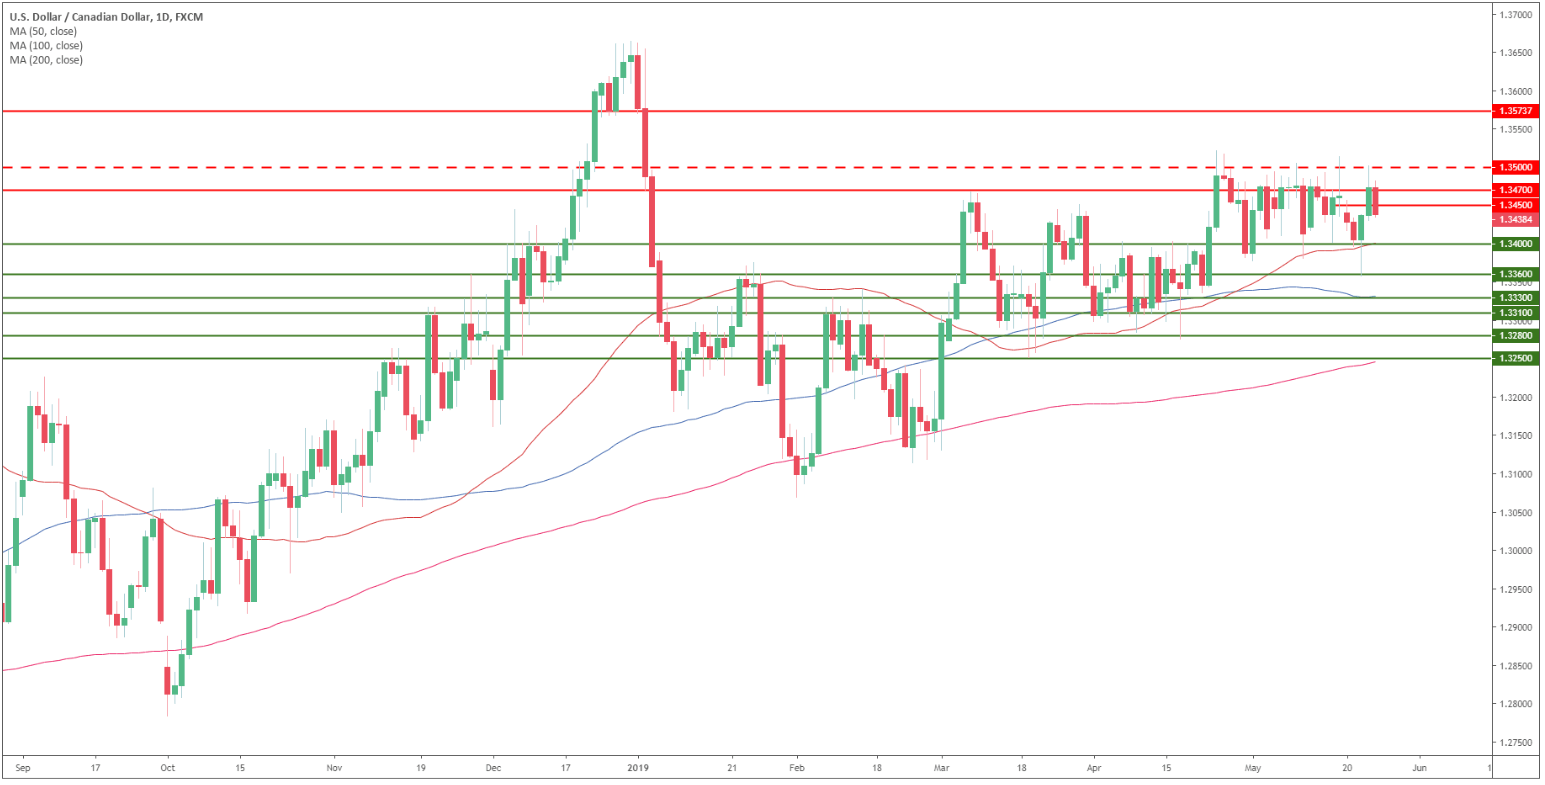
USD/CAD daily chart
USD/CAD is trapped in the 1.3400-1.3500 range as it is evolving above its main simple moving averages (SMAs).
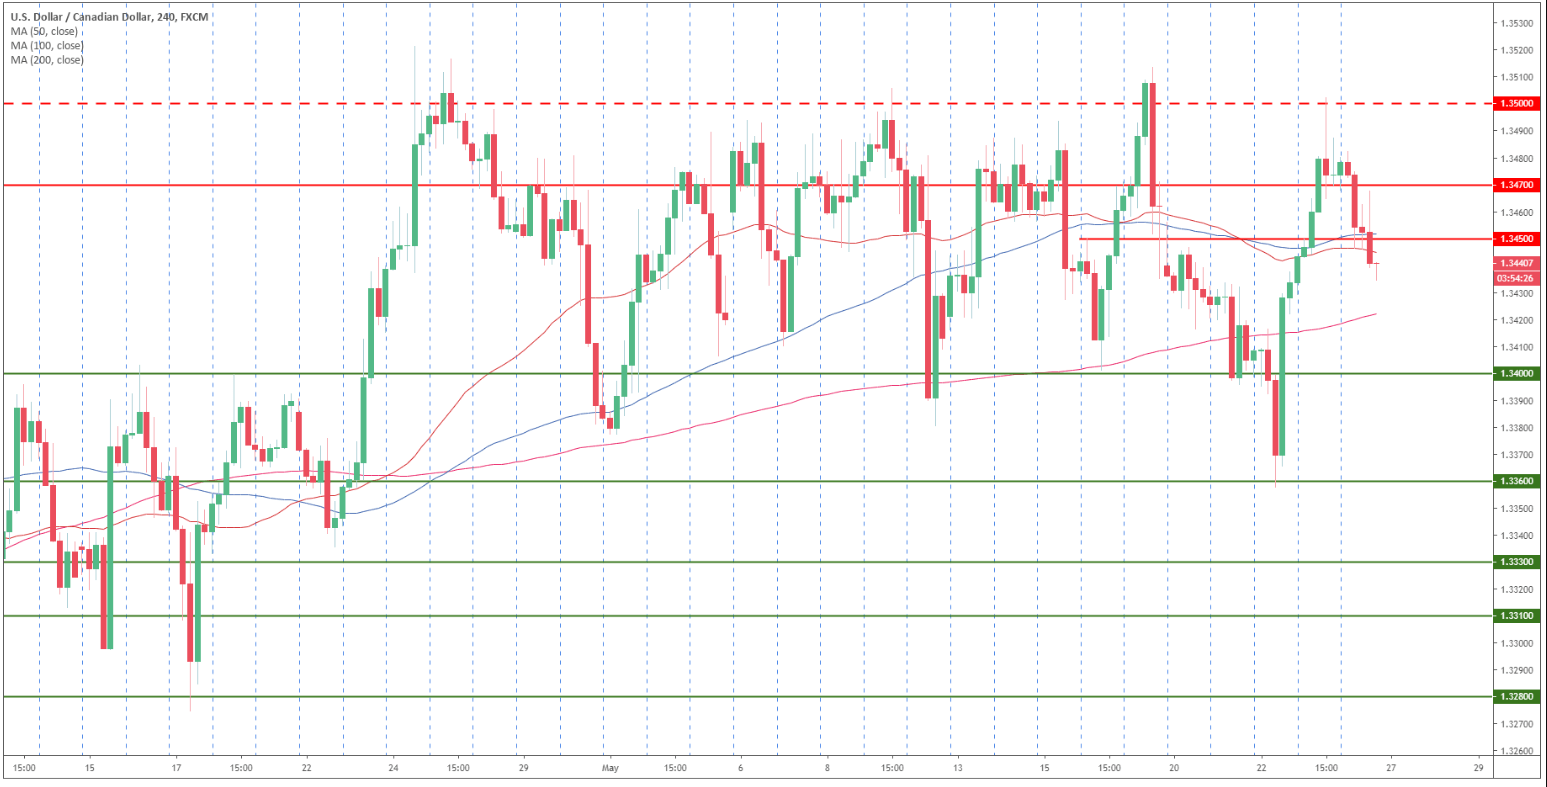
USD/CAD 4-hour chart
USD/CAD is rejecting the 1.3500 and 1.3450 resistance.
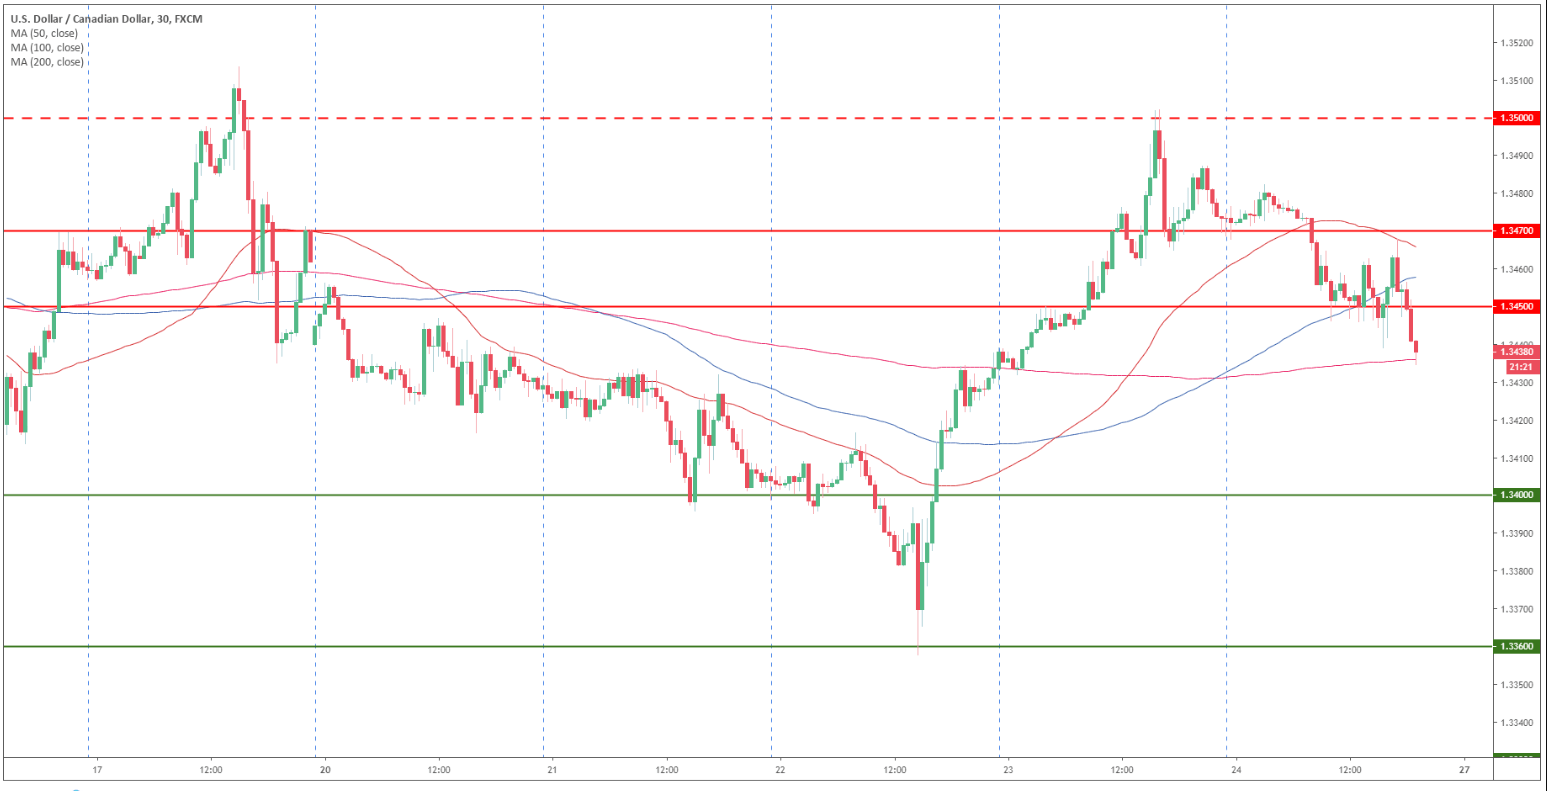
USD/CAD 30-minute chart
USD/CAD is trading below its 50 and 100 SMAs suggesting a correction down. 1.3400 can be the next meeting point to the downside followed by 1.3360 support. Resistances are at 1.3450, 1.3470 and 1.3500 figure.
Additional key levels