USD/JPY Technical Analysis: Greenback trading below 109.50 against the Japanese Yen
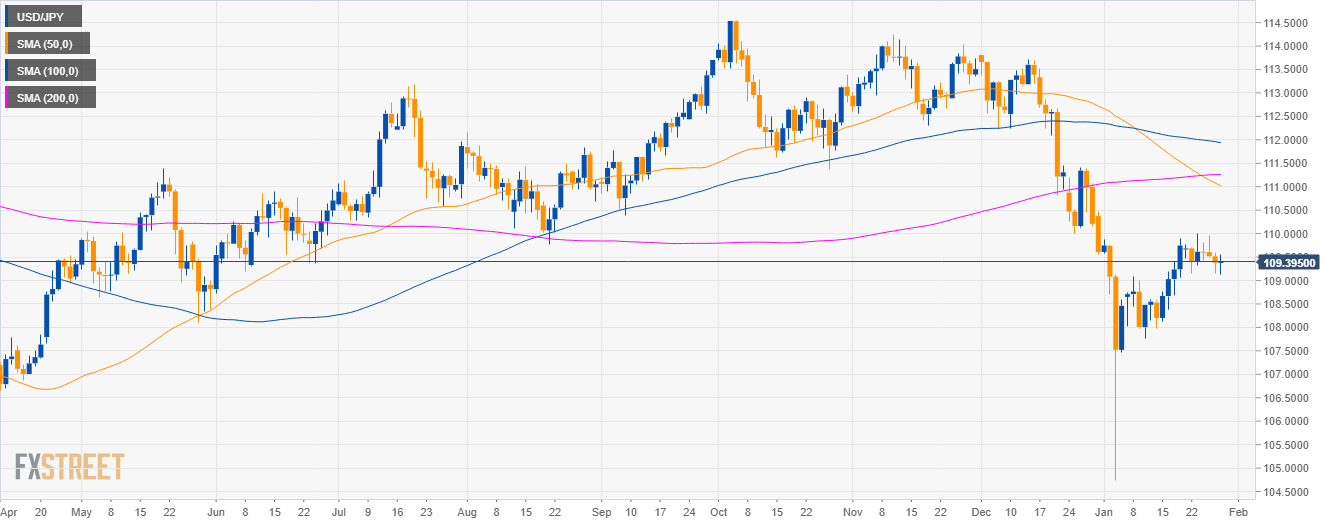
USD/JPY daily chart
- USD/JPY is trading in a deep pullback below the 50, 100 and 200-day simple moving averages (SMAs) on the daily chart.
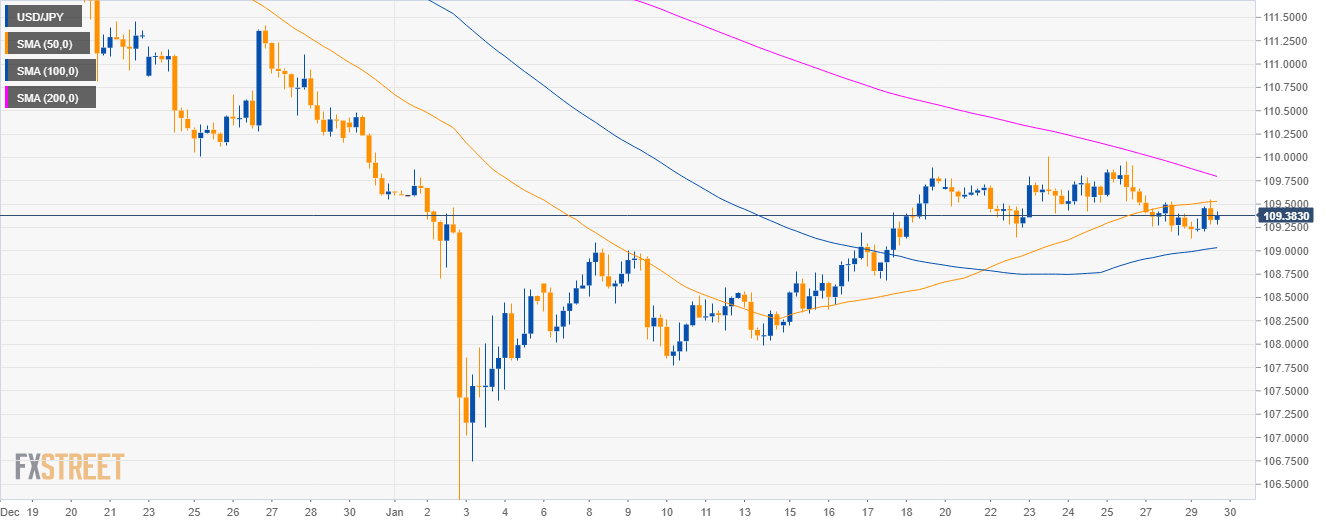
USD/JPY 4-hour chart
- USD/JPY is trading below the 50 and 200 SMAs suggesting bearish momentum in the medium-term.
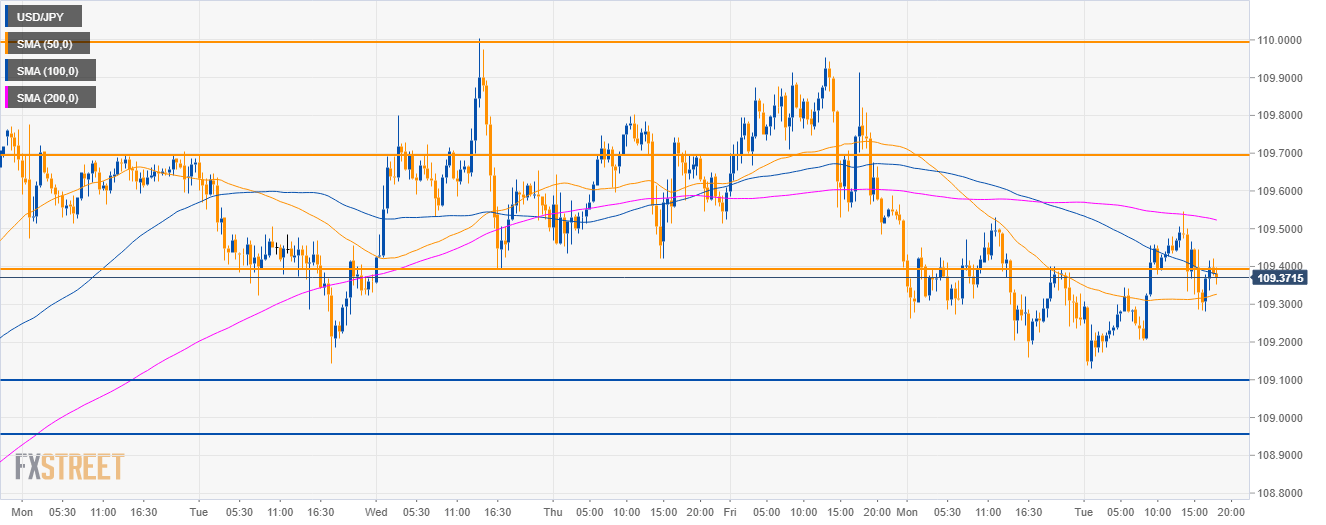
USD/JPY 30-minute chart
- USD/JPY bears rejected the 109.50 level and the 200 SMA as the market is now back near 109.40 key level.
- Bears should continue to stay in charge with targets to the downside near 109.10 and 108.95.
- Resistances are seen at the 109.40/50 and 109.70 level.
Additional key levels
USD/JPY
Overview:
Today Last Price: 109.36
Today Daily change: -2 pips
Today Daily change %: -0.02%
Today Daily Open: 109.38
Trends:
Daily SMA20: 108.97
Daily SMA50: 111.08
Daily SMA100: 111.96
Daily SMA200: 111.26
Levels:
Previous Daily High: 109.59
Previous Daily Low: 109.16
Previous Weekly High: 110
Previous Weekly Low: 109.14
Previous Monthly High: 113.83
Previous Monthly Low: 109.55
Daily Fibonacci 38.2%: 109.32
Daily Fibonacci 61.8%: 109.43
Daily Pivot Point S1: 109.16
Daily Pivot Point S2: 108.95
Daily Pivot Point S3: 108.73
Daily Pivot Point R1: 109.59
Daily Pivot Point R2: 109.8
Daily Pivot Point R3: 110.02