Back
20 Nov 2018
EUR/USD Technical Analysis: Current bull move looking weak in the near-term
- The last twenty-four hours in the EUR/USD sees intraday action near the 1.1450 level heading into Tuesday's major market sessions, after catching a confusing lift on Monday from a floor near 1.1390.
- Intraday support is sitting at the 38.2% Fibo retracement level near 1.1435, and it could be a pivotal intraday zone.
- EUR/USD Analysis: Rallies despite Italian budgetary concerns
EUR/USD Chart, 5-Minute
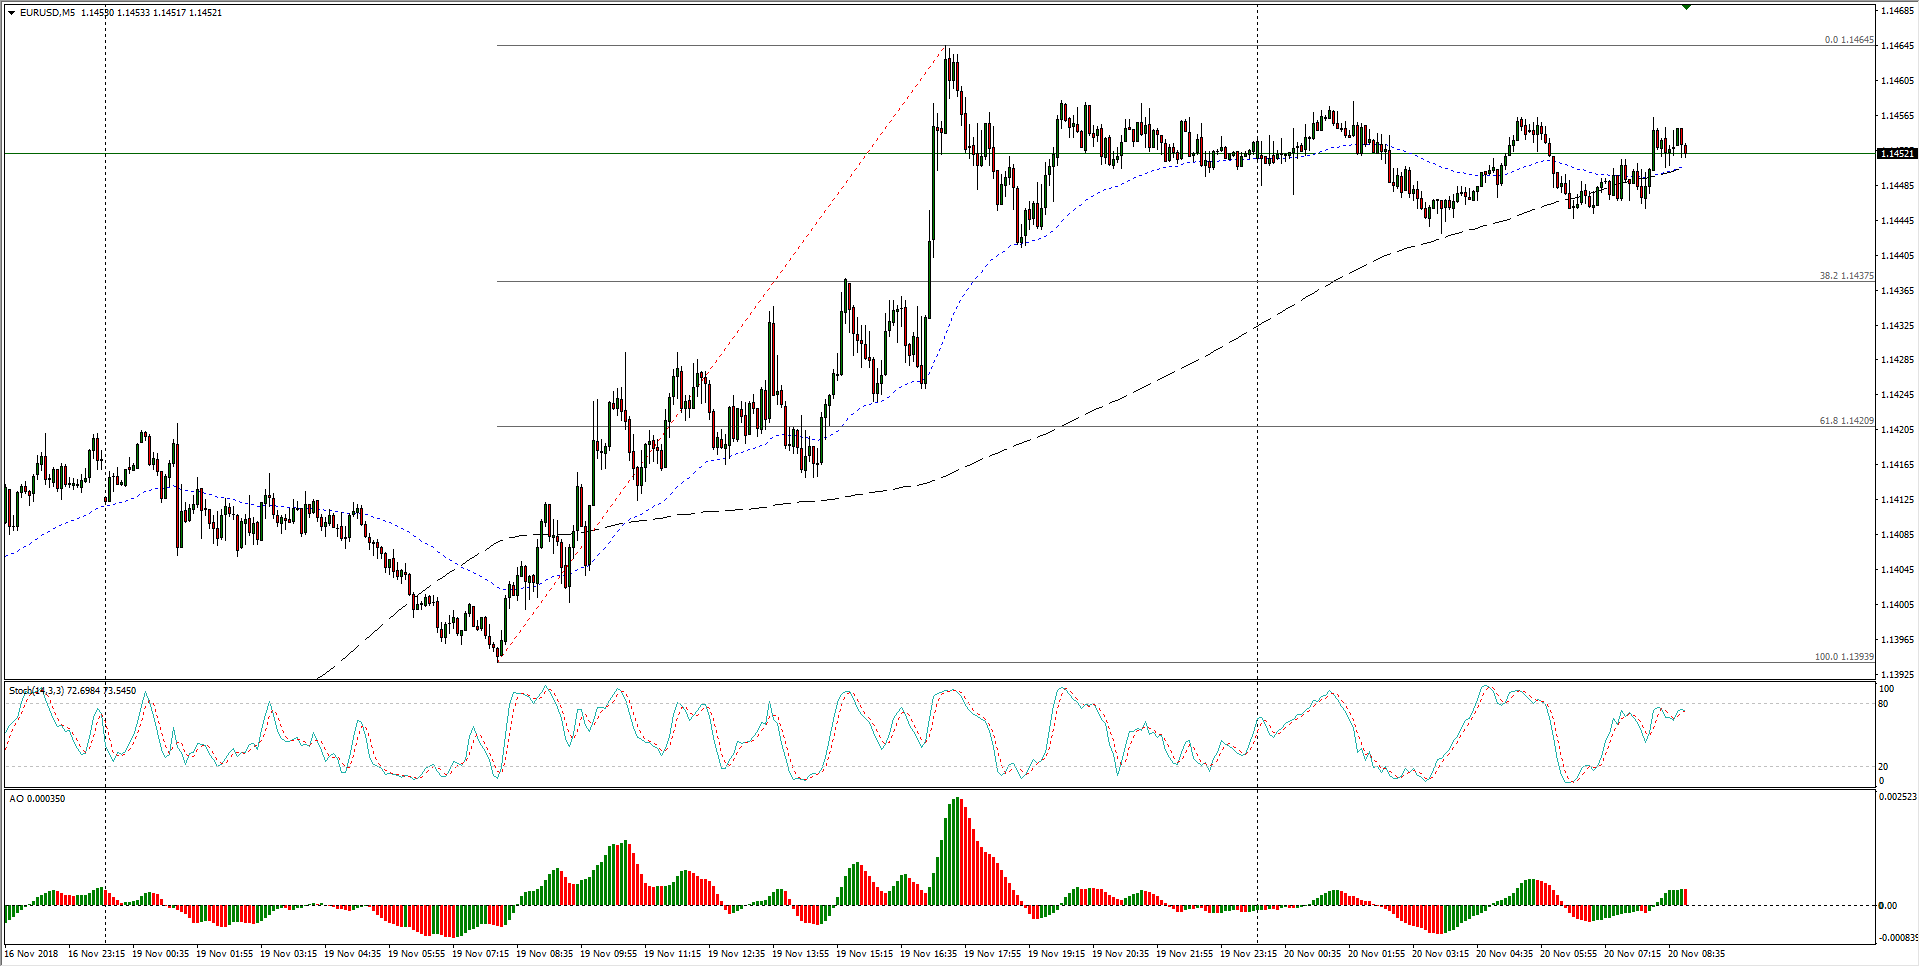
- Over the past two weeks, the Fiber bounced from the 1.1200 zone to stage a near-term bullish correction, and with the 100-hour moving average resting at 1.1360, a decline to this region is likely to see some bidding about the region as buyers try to force a fresh higher low.
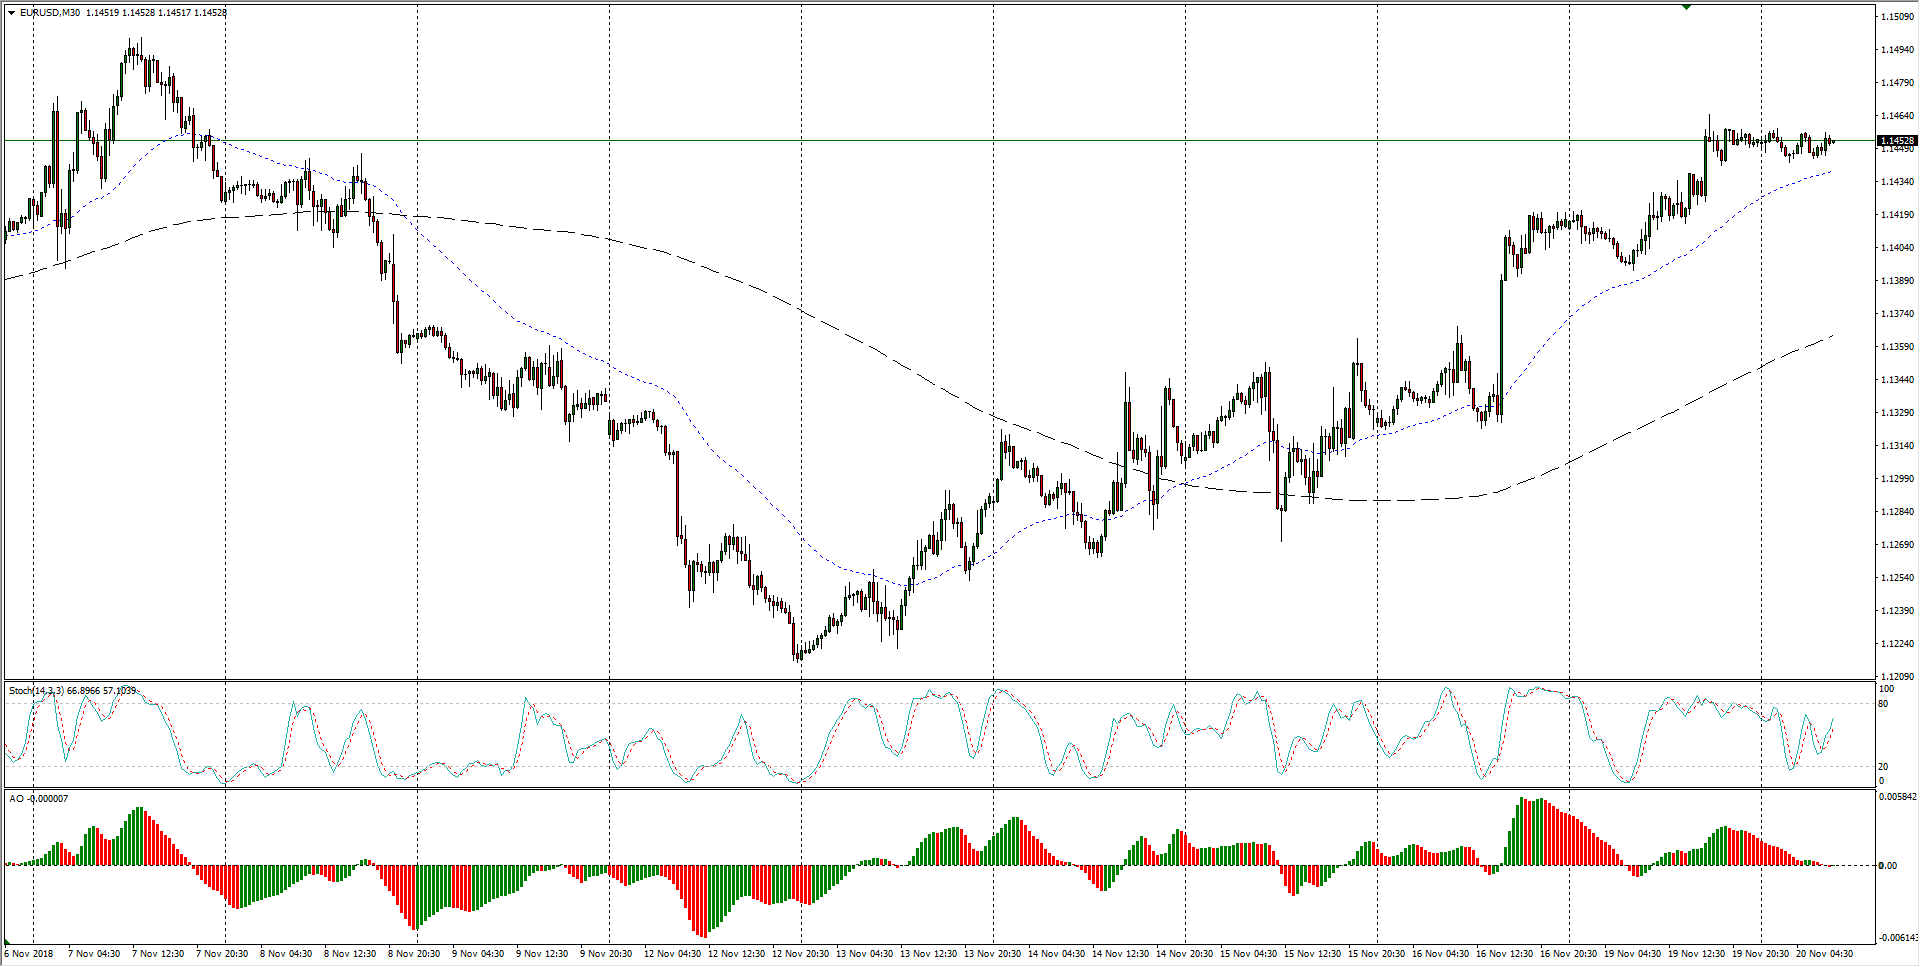
EUR/USD Chart, 30-Minute
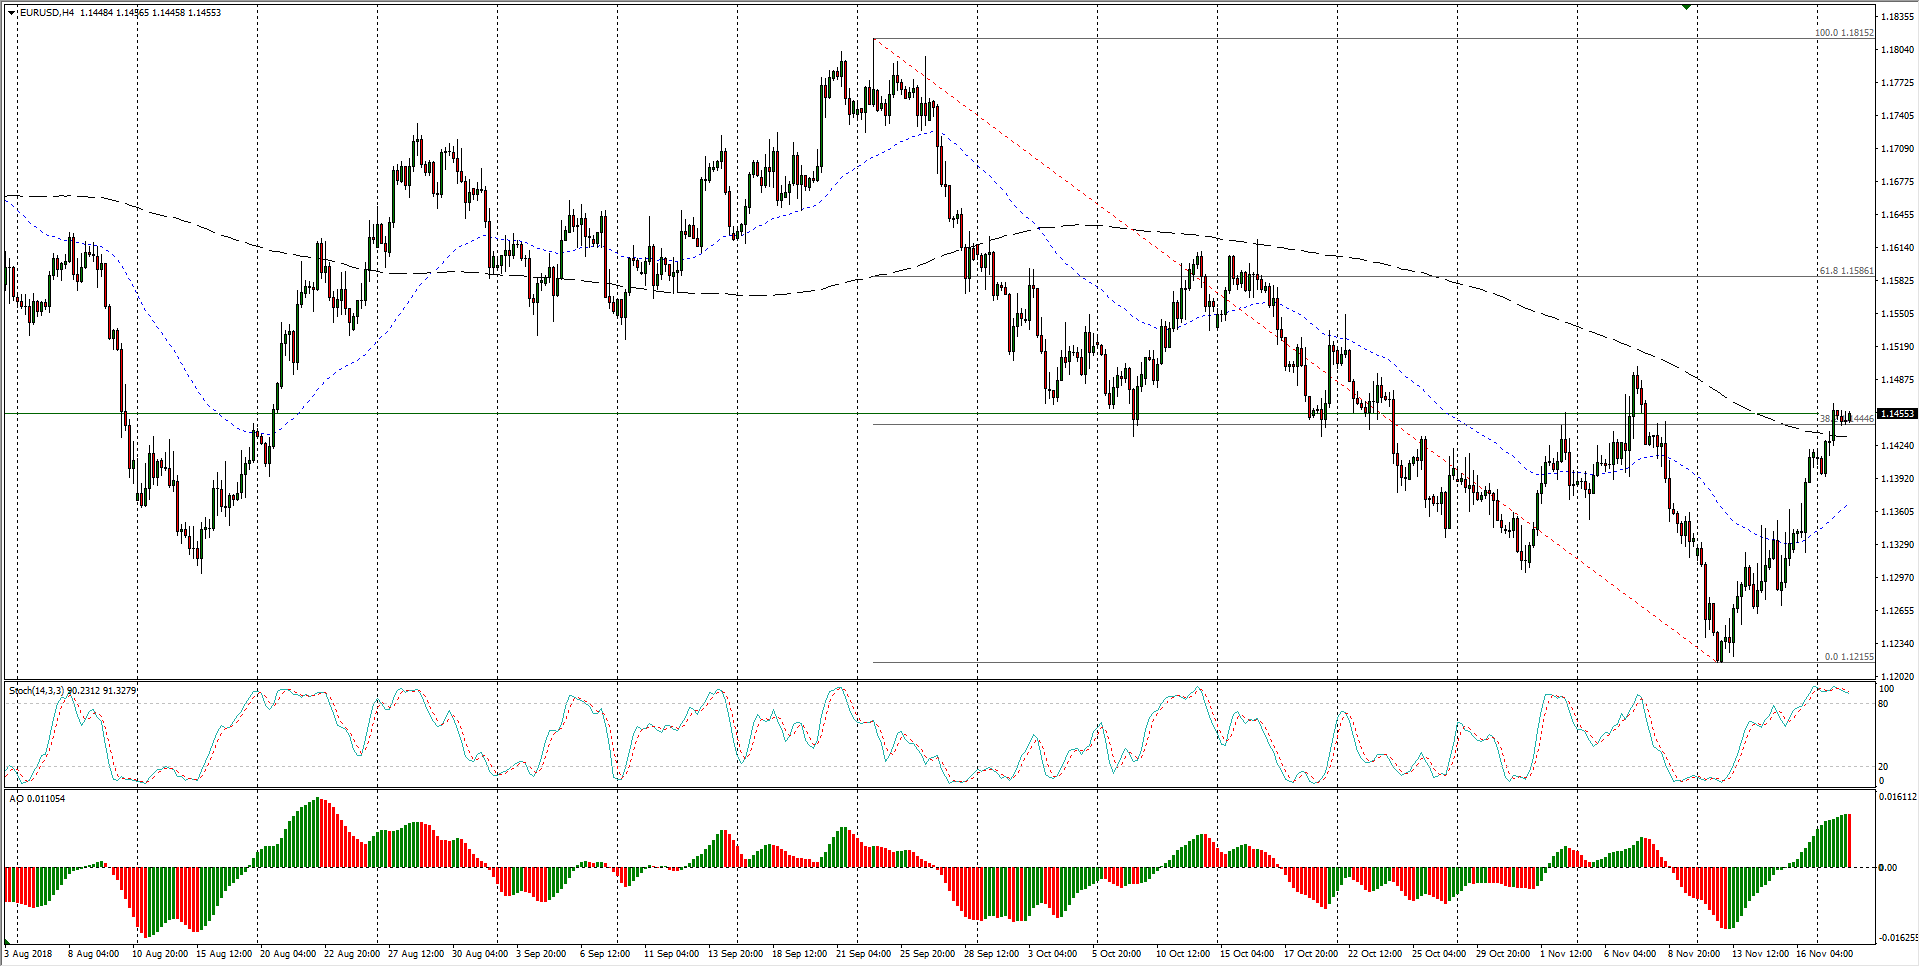
- Going back over the past four months, the EUR/USD remains in a dedicated downtrend, though medium-term boundaries are currently being tested, with the latest bull run facing a confluence zone at the 38.2% Fibo retracement level alongside the 200-period moving average, a dynamic resistance indicator that has kept the Fiber in chains since falling from a medium-term peak of 1.1815.
EUR/USD Chart, 4-Hour
EUR/USD
Overview:
Last Price: 1.1453
Daily change: 1.0 pips
Daily change: 0.00873%
Daily Open: 1.1452
Trends:
Daily SMA20: 1.1374
Daily SMA50: 1.1509
Daily SMA100: 1.1561
Daily SMA200: 1.1811
Levels:
Daily High: 1.1466
Daily Low: 1.1394
Weekly High: 1.142
Weekly Low: 1.1216
Monthly High: 1.1625
Monthly Low: 1.1302
Daily Fibonacci 38.2%: 1.1438
Daily Fibonacci 61.8%: 1.1421
Daily Pivot Point S1: 1.1409
Daily Pivot Point S2: 1.1365
Daily Pivot Point S3: 1.1336
Daily Pivot Point R1: 1.1481
Daily Pivot Point R2: 1.1509
Daily Pivot Point R3: 1.1553