EUR/USD Price Analysis: Holds above the 1.0800 mark, upside seems limited
- EUR/USD holds below the 50- and 100-day EMAs on a four-hour chart.
- The Relative Strength Index (RSI) remains in bearish territory.
- The first resistance level appears at 1.0845-1.0850 region; the key support level to watch is 1.0800.
The EUR/USD pair recovers some lost ground but the upside seem limited during the early European session on Tuesday. The major pair currently trades near 1.0816, losing 0.03% on the day. The odds of additional interest rate hikes by the Federal Reserve (Fed) lift US bond yields and limit USD losses.
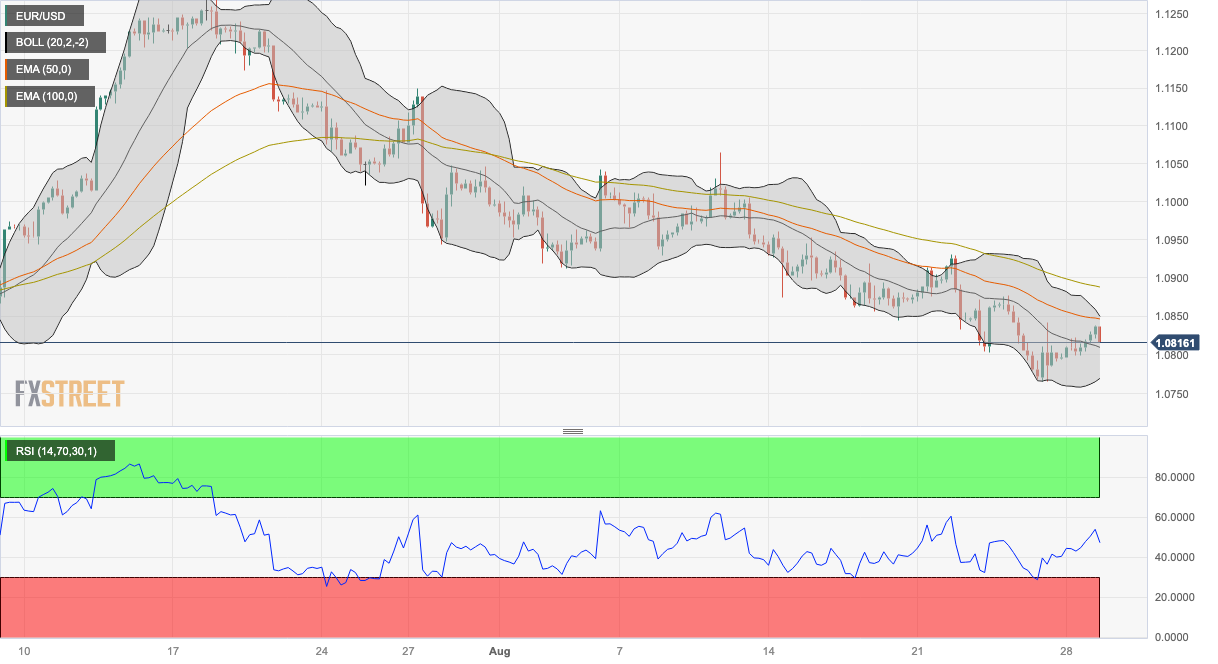
According to the four-hour chart, the major pair holds below the 50- and 100-day Exponential Moving Averages (EMAs), implying the path of least resistance for the EUR/USD is to the downside. Adding to this, the Relative Strength Index (RSI) remains below 50, supporting EUR/USD sellers for now.
The immediate resistance level for EUR/USD appears at 1.0845-1.0850 region, representing a confluence of the 50-hour EMA and the upper boundary of the Bollinger Band. Further north, the pair will challenge the next hurdle at 1.0890 (100-hour EMA).
Any meaningful follow-through buying beyond the latter could pave the way to the next barrier at 1.0930 (a high of August 22) en route to 1.1000 (a psychological round mark, a high of August 8)and finally at 1.1065 (a high of August 10).
On the flip side, the key support level to watch is 1.0800, portraying a psychological round mark and a low of August 23. The additional downside stop is near the limit of the Bollinger Band and a low of August 25 at the 1.0765-1.0770 region. A decisive break below the latter would fuel a drop towards 1.0735 (a low of June 12) and 1.0675 (a low of June 6).
EUR/USD one-hour chart

