GBP/JPY Price Analysis: DOji emerges, threatening to send prices tumbling below 161.00
- The GBP/JPY three-day rally stalled around the 20-DMA and the 161.00 mark.
- Oscillators suggest the GBP/JPY might continue its downtrend, but a decisive break above 161.00 could set the pair to challenge the 200-DMA.
On Tuesday, the GBP/JPY registered solid gains, but the rally stalled around the 20-day Exponential Moving Average (EMA) at 161.08, as sellers leaning into it stepped in, dragging the GBP/JPY lower. Nevertheless, as Wednesday’s Asian session begins, the GBP/JPY is almost unchanged at around 161.02.
GBP/JPY Price Analysis: Technical outlook
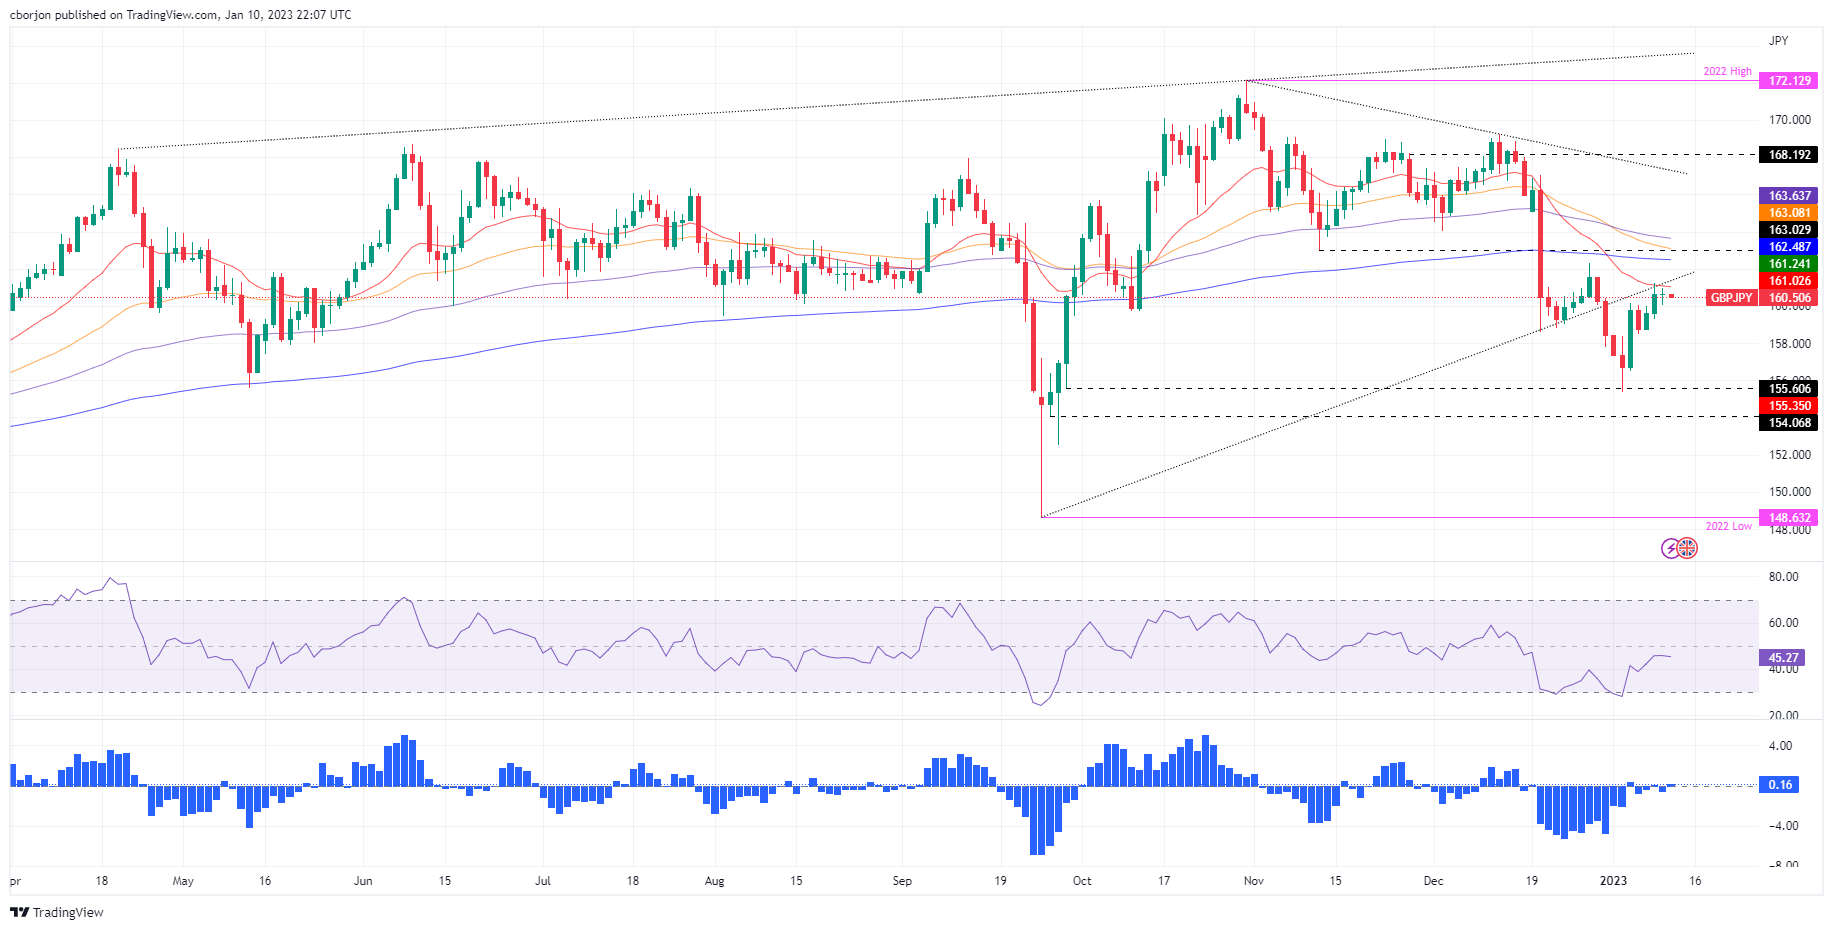
From a daily chart perspective, the GBP/JPY is neutral-to-downward biased. In the last two days, the GBP/JPY has been unable to crack the confluence of two technical indicators: the 20-day EMA and a five-month-old upslope support trendline, which turned resistance around the 161.00 mark. If the GBP/JPY pierces that latter, that would be the first step for higher prices, but its next hurdle would be the January 9 daily high of 161.24. A breach of the latter will clear the space towards the 200-day EMA at 162.50, followed by the 163.00 mark.
If that scenario is to play out, oscillators like the Relative Strength Index (RSI) would need to shift bullish, as it remains in bearish territory, while the Rate of Change (RoC) needs to show that selling pressure is waning. Otherwise, the GBP/JPY downtrend would resume.
Hence, the GBP/JPY first support would be the January 10 swing low of 160.04, followed by essential support levels like this week’s low of 159.30, ahead of 159.00.
GBP/JPY Key Technical Levels